Intraday Breakout Trading Strategy
In this article, I am going to discuss Intraday Breakout Trading Strategy in detail. Please read our previous article where we discussed How to Trade with Support and Resistance in detail. As part of this article, the following pointers are going to be discussed in detail.
- What is the Intraday Breakout Trading Strategy?
- Merit and demerit of breakout trading
- When should void breakout trade?
- How to find high probability breakout trading?
- Price action for the breakout bar
- How to enter a breakout?
What is Intraday Breakout Trading Strategy?
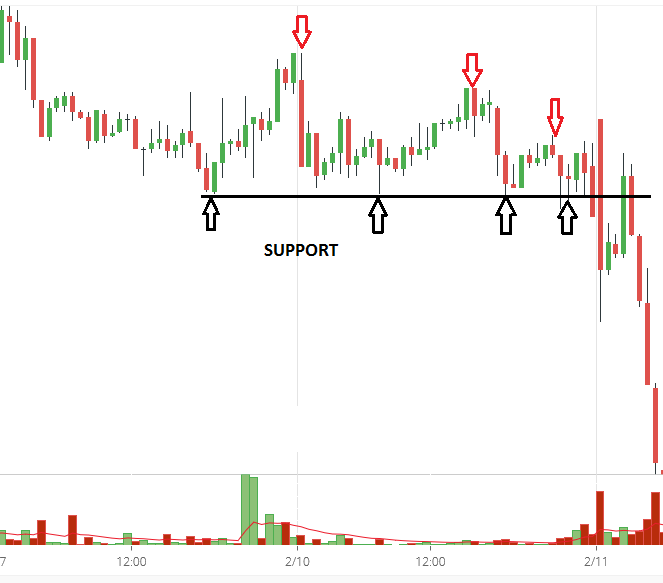
Break out means moves below any support or above any resistance. Price breakout from
- First support and resistance is a break of previous candle high or low
- Last swing high or low (shorter-term support and resistance)
- Major support and resistance
- Trend line or moving average
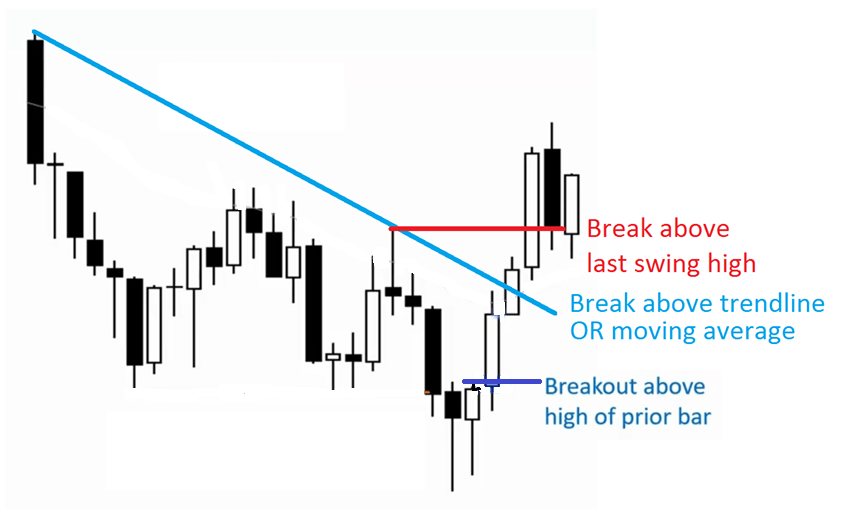
Benefits of Intraday Breakout Trading Strategy:
There are several benefits to trading breakouts. For example
- Momentum is with you – Trading breakouts allow you to enter your trade with momentum at your back
- Catch big trends – If you were to trade pullbacks, sometimes it may never come. But with breakouts, you never have to worry about missing another move in the markets
The demerit of Breakout Trading Strategy:
False breakout or trap
When should we avoid trading breakouts?
- Don’t trade breakouts when the market is far from Support/Resistance (S/R) and Are there obstacles overhead or underfoot that could possibly obstruct an advance or decline
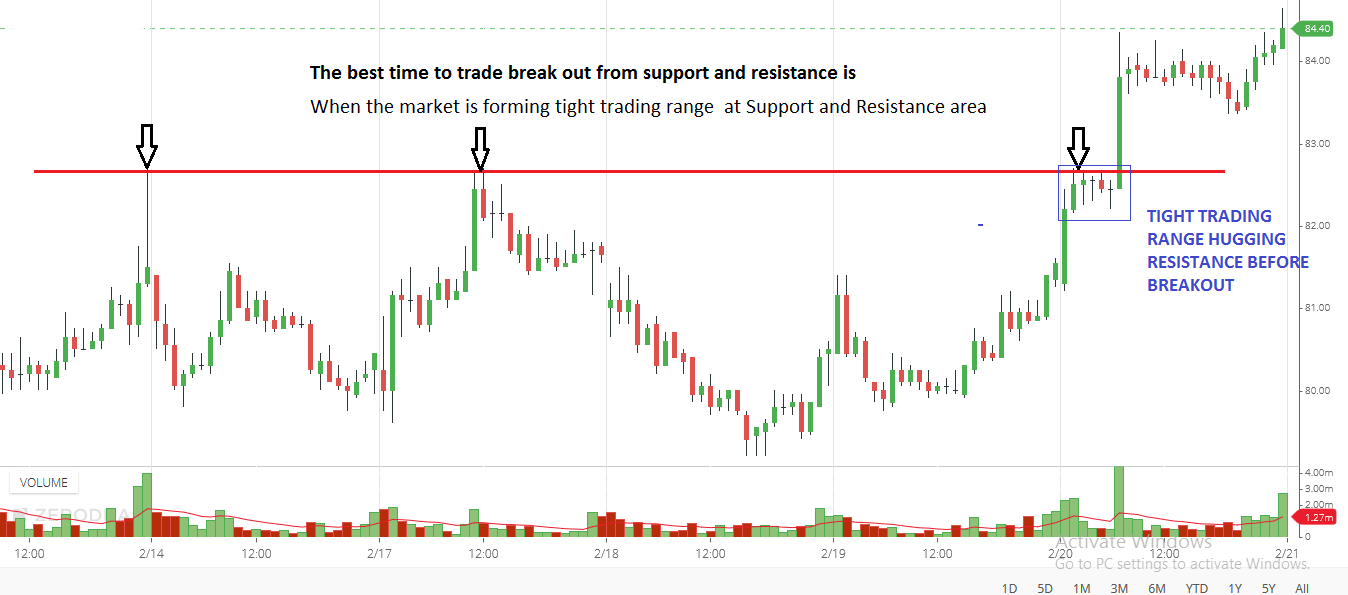
- Don’t trade breakouts without TIGHT TRADING RANGE (consolidation) before the breakout
- Don’t trade breakout when the break set against the dominant pressure
Don’t trade breakouts when the market is far from Support or Resistance (S/R) Why?
Because you don’t have a logical level to place your stop loss. Even if you do, it usually results in a poor risk to reward profile Based on the stop loss placement we can divide the break out into three types
False Breaks, Tease Breaks, and Proper Breaks
Whether to take a position or not on a break is always a function of how well the technical credentials of the chart back up the prospects for follow-through.

The difference in consolidation prior to a breakout not only affects the likelihood of follow-through but the level for protection as well. An excellent way to play a break is shown in Situation 3. Now we can truly see the virtues of proper consolidation up. The breakout may still fail soon after, but technically seen, this is the more favorable scenario
Don’t trade breakouts without consolidation
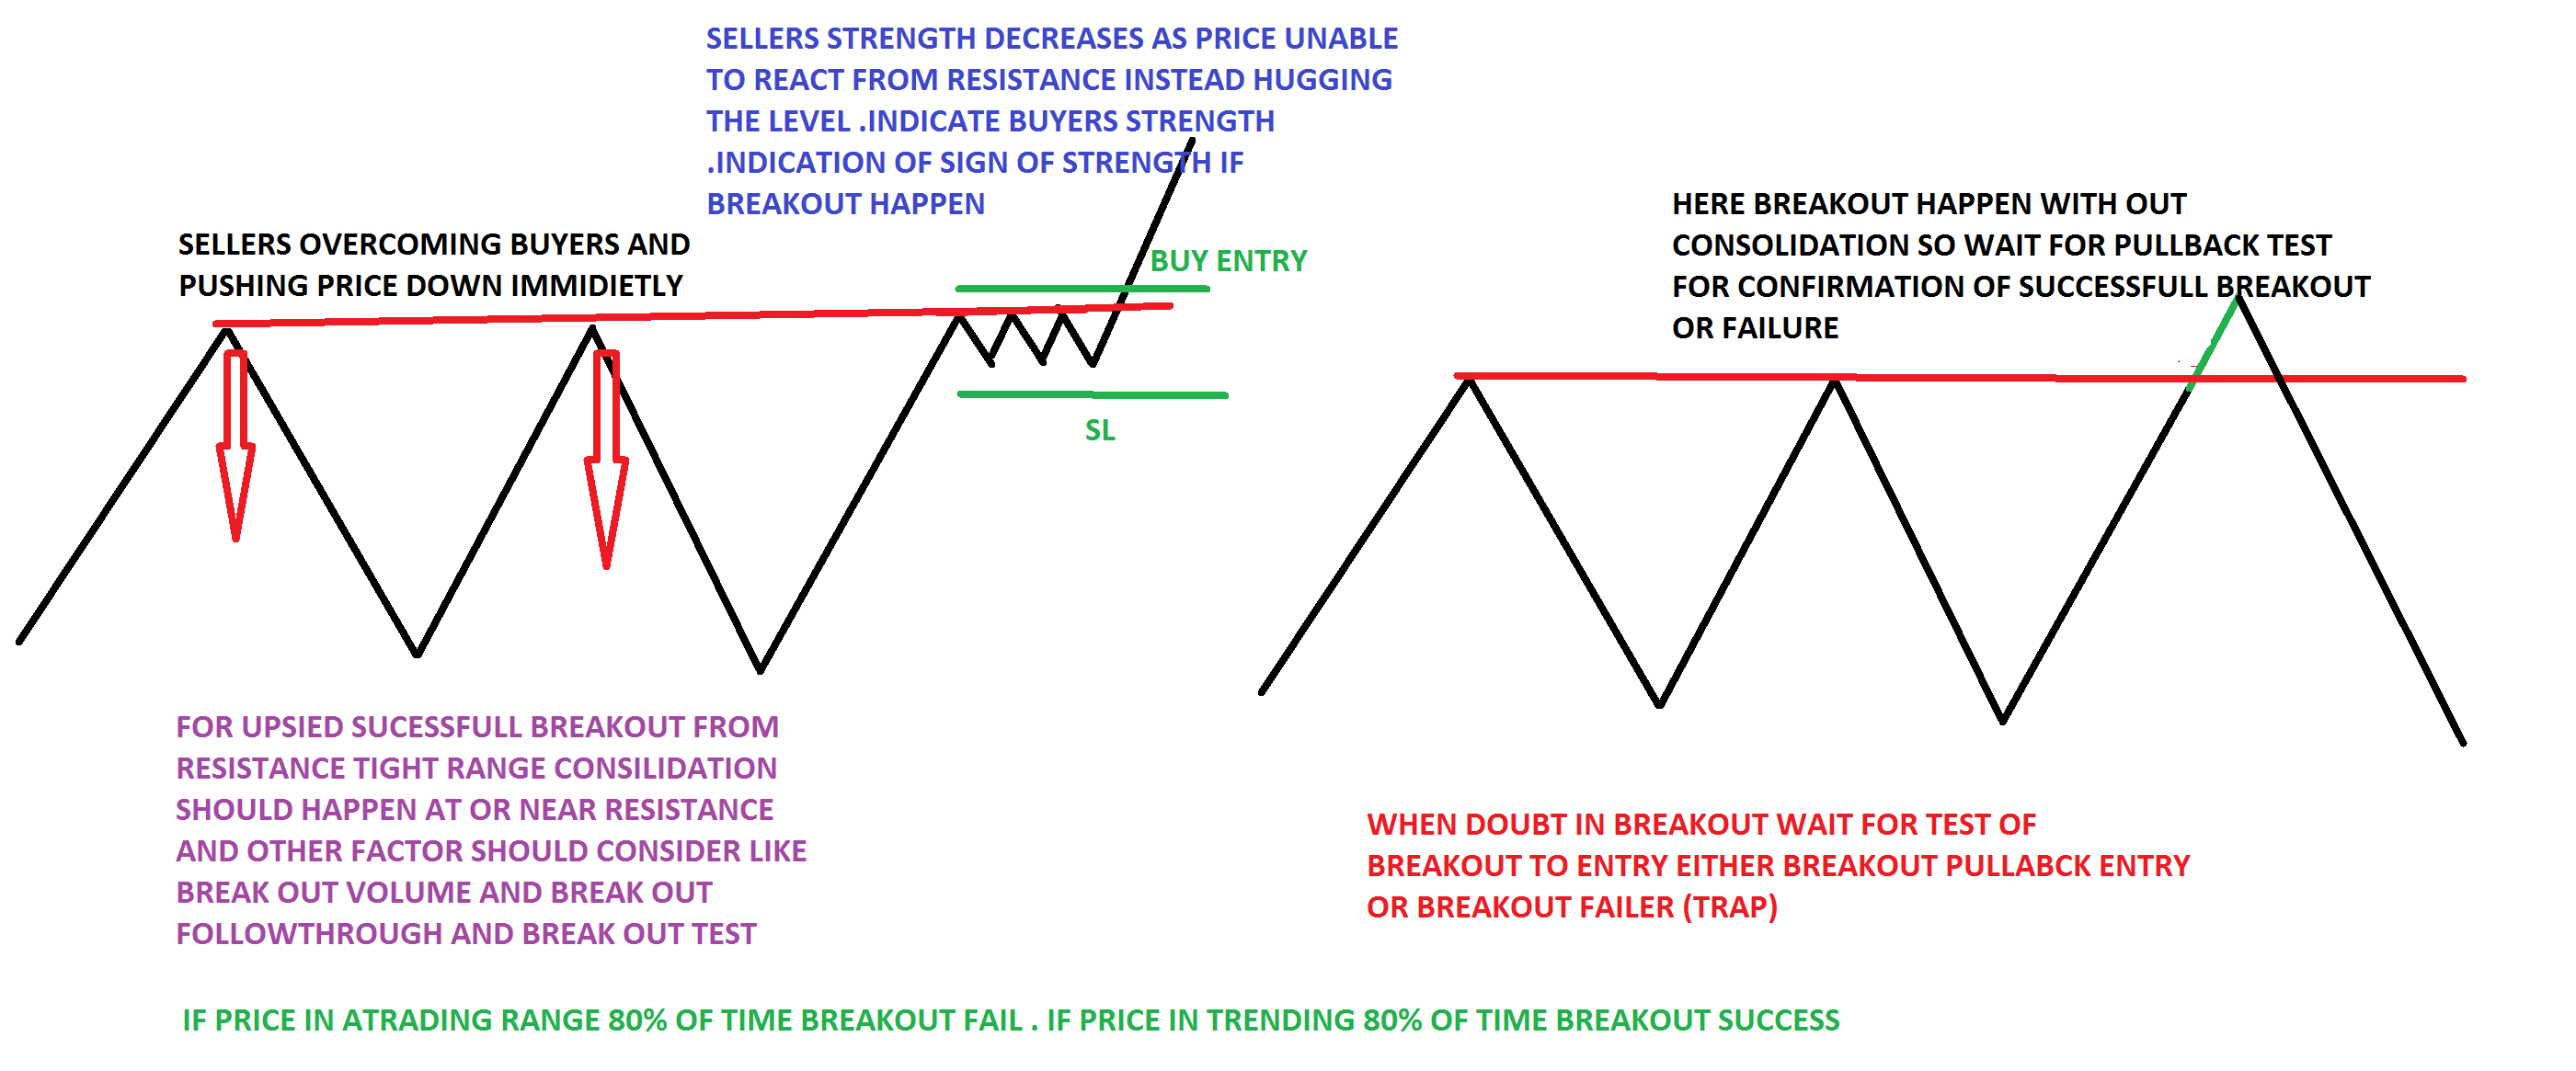
Why is this so?
Traders in profit will exit their positions at the nearest swing high (to protect their profits). And traders looking to short will do so at the swing high. So here’s what happens…
You get a double dose of selling pressure. From traders exiting their long trades (by selling), and traders looking to short the markets. With so much selling pressure in the same area, chances are, the breakout would fail if the breakout happens without consolidation.
DON’T TRADE AGAINST THE Higher Time Frame Support and Resistance
 How to find high probability breakout trades
Based on my experience, these are the best times to trade breakout:
- When the market is trending strongly
- When there’s no Support/Resistance nearby
- When the market is forming consolidation at Support and Resistance area
- When there are higher lows into Resistance or lower highs into Support
Let me explain you above four points in details
1. When the market is trending strongly
If the market is trending strongly, you’re unlikely to catch the trend on a pullback. So, what can you do? Well… you can trade the breakout, right?
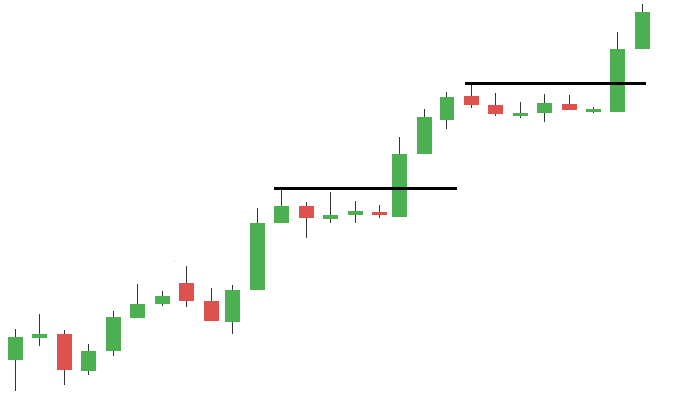
You can get long when the price trades above the swing high, and place your stops below the last swing low
2. When there’s no Support/Resistance nearby
Think about this. If you’re short of the market, where would buyers come in? If you’re long the market, where would sellers come in? Support and Resistance, right?
3. When the market is forming consolidation at the Support and Resistance area
Why do you want to trade breakouts with consolidation?
Here’s why: A consolidation would attract stops in the market as traders place their stop-loss beyond the highs/lows of the consolidation.
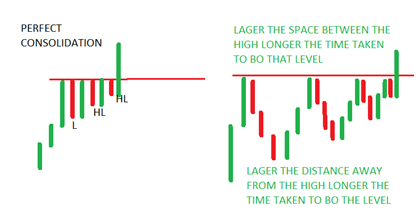
It could be to protect their existing positions or to trade the breakout in either direction. So, when the market breaks out of consolidation, you get a double dose of pressure. And it’s caused by traders looking to protect their positions and traders looking to trade the breakout. An example:
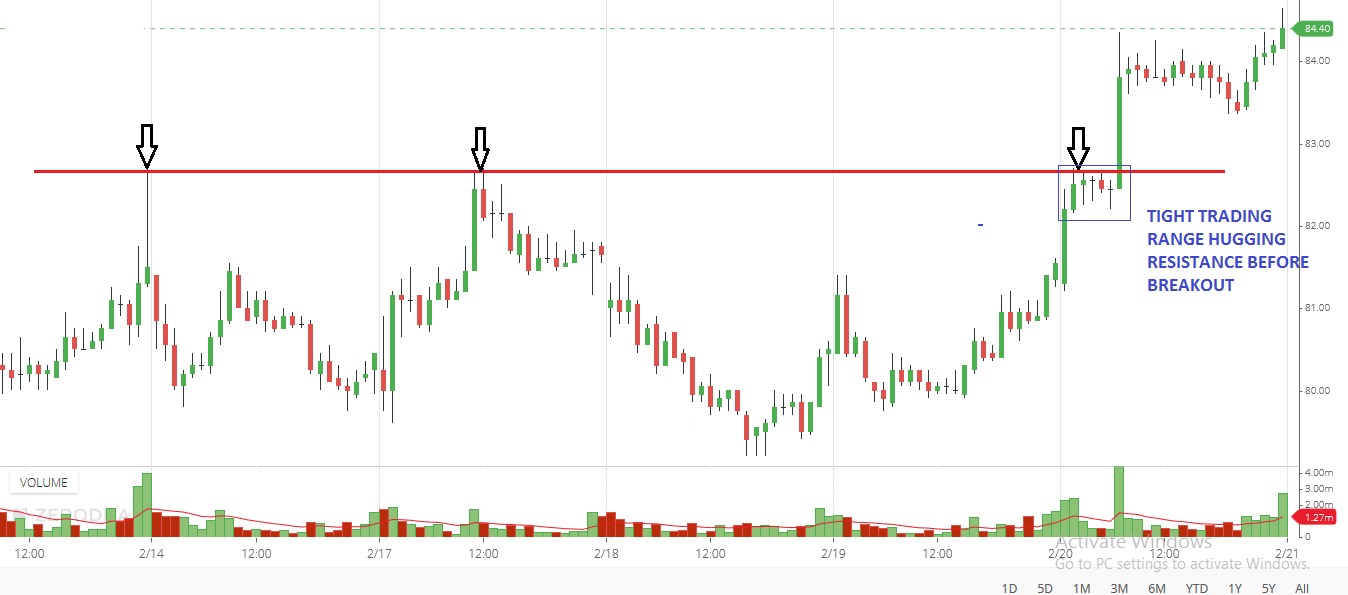
CONSOLIDATION
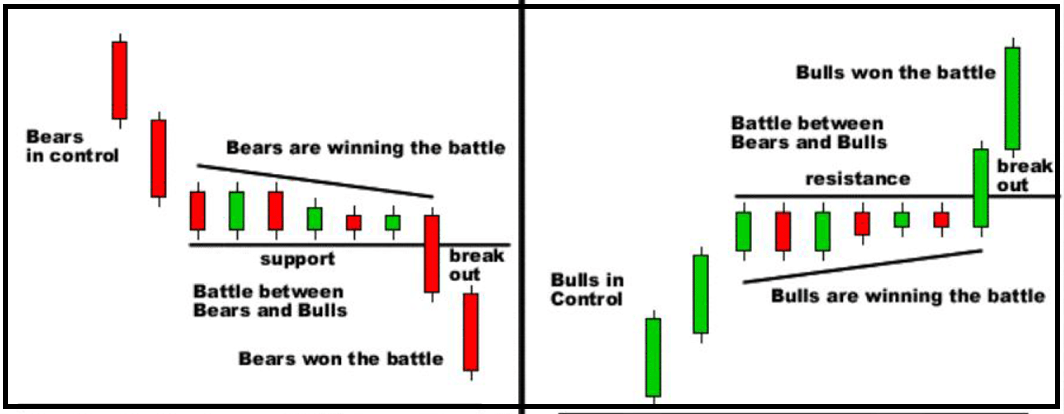
4. When there are higher lows into Resistance or lower highs into Support
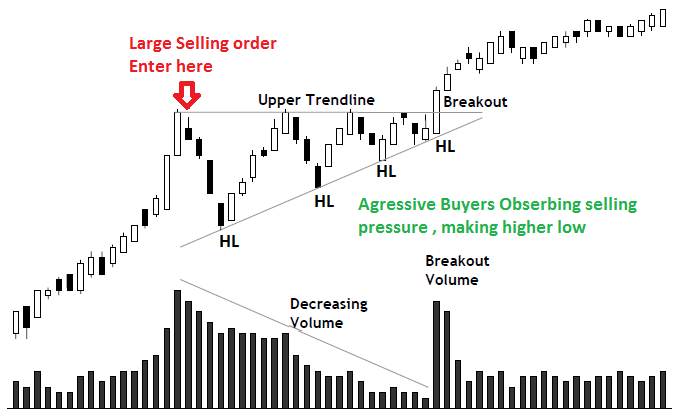
Higher lows into Resistance is a sign of strength by the buyers and there’s a good chance the market will break out higher. Why?
Because if there were strong selling pressure at resistance, the price should have fallen quickly. The fact it didn’t tell you that buyers are willing to buy at higher prices and thus forming higher lows into Resistance. Visually, it looks like an ascending triangle. Here’s an example:
And when you get lower highs into Support, it’s a sign of strength by the sellers. Because if there were strong buying pressure at Support, the price should have risen quickly. The fact it didn’t tell you that sellers are willing to sell at lower prices and thus forming lower highs. Visually, it looks like a descending triangle. An example:
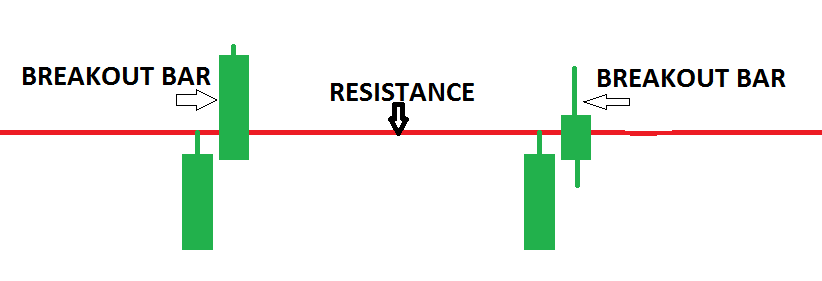
Breakout bars for upside
- The bar that breaks structure (resistance line)
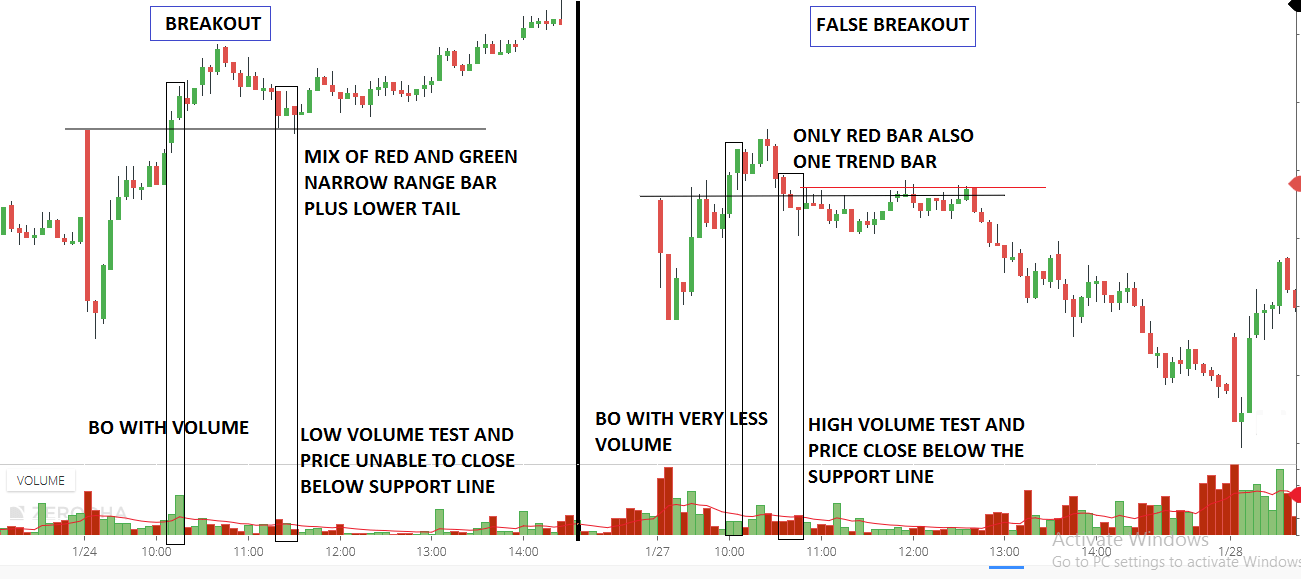
- Volume should dramatically increase
- If the follow-through bar is large, the odds of the trend continuing are greater
- The first pullback occurs after 3or more bar of a breakout with low volume and lower tail
Breakout and breakout bar
The bar has a full trend body and small tails or no tails, the larger the body, the more likely breakout will succeed. A widespread up bar closing on the highs pushing up and through an old top to the left. It is an effort to go up as it is showing demand. After this event the market usually rests or starts to react, you are now looking for indications of strength to confirm the strength
Breakout and volume
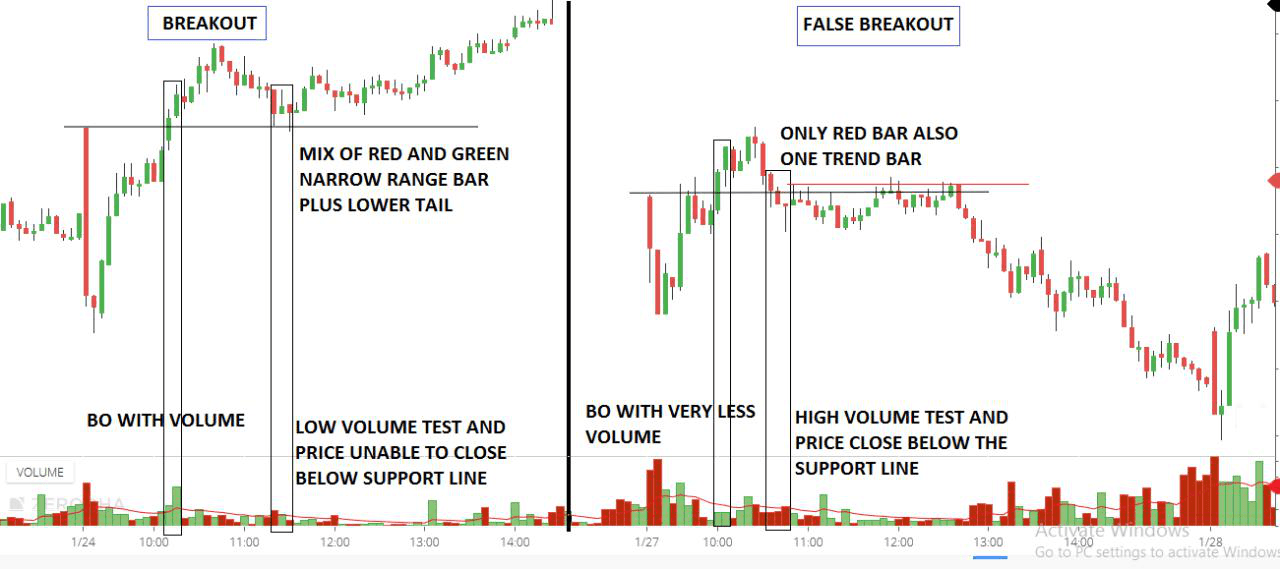
If you observe a wide spread up, on high volume, punching through the top of a resistance (supply line), and the next day is level or even higher, then you would now be expecting higher prices. Any low volume down-day (potential test) will confirm this view
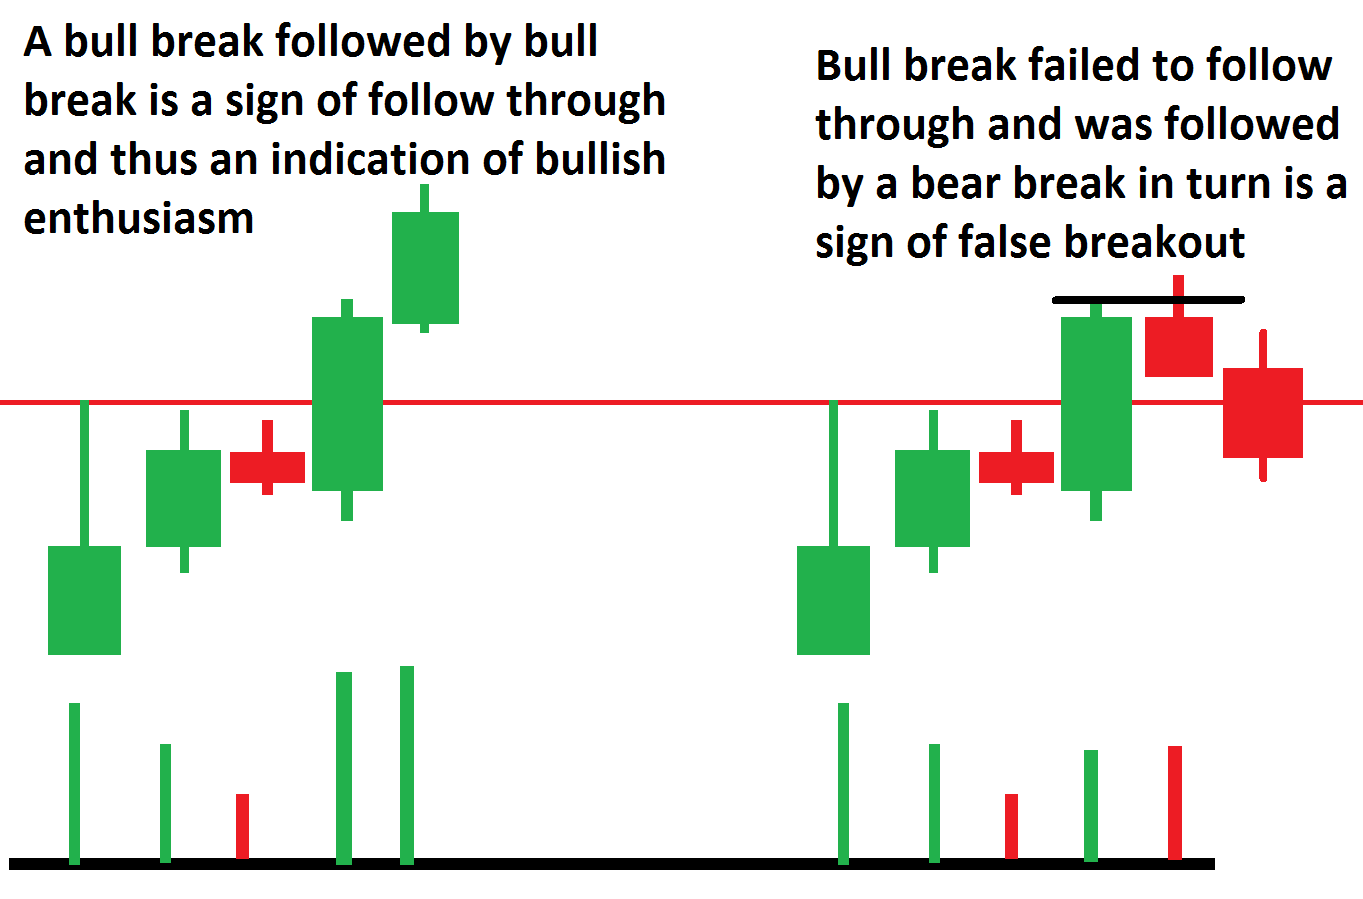
BREAK OUT bar NEEDS FOLLOWTHROUGH
Traders like to see a confirmation after the breakout. One more trend bar after breakout bar. A bull break followed by a bull break is a sign of follow-through and thus an indication of bullish enthusiasm, for as long as it lasts. Should we see the market respond to a bull break with a bearish bar and this bar then gets broken at the bottom by another that gives us valuable information also: technically seen, we are dealing with a false break. It shows false as the bull break failed to follow through and was followed by a bear break-in turn.
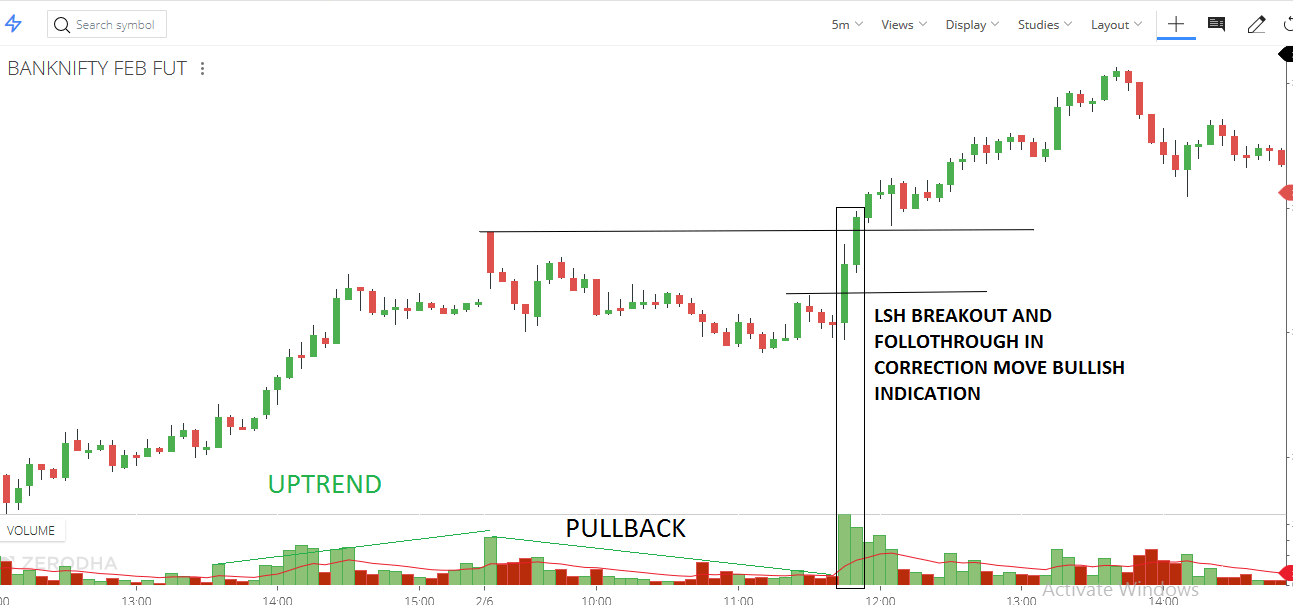
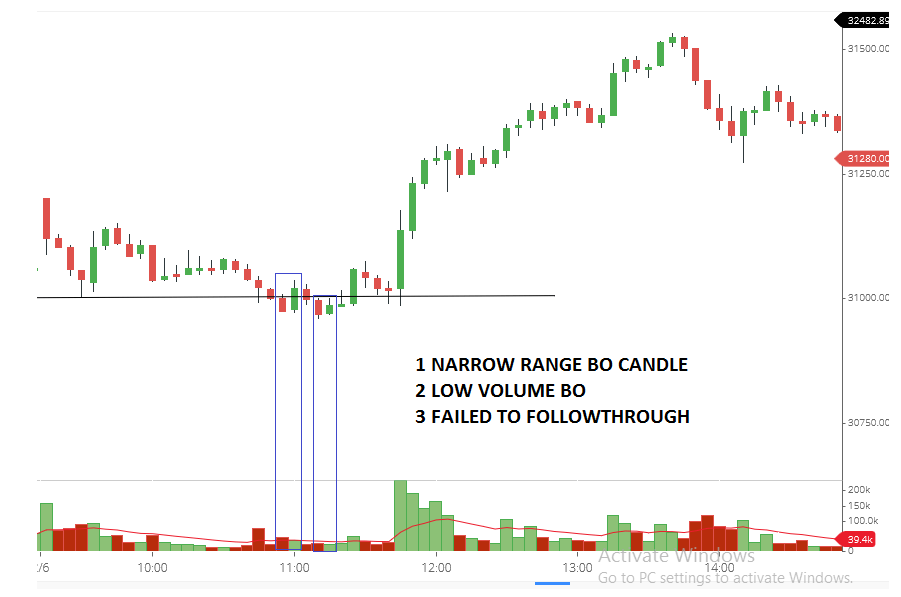
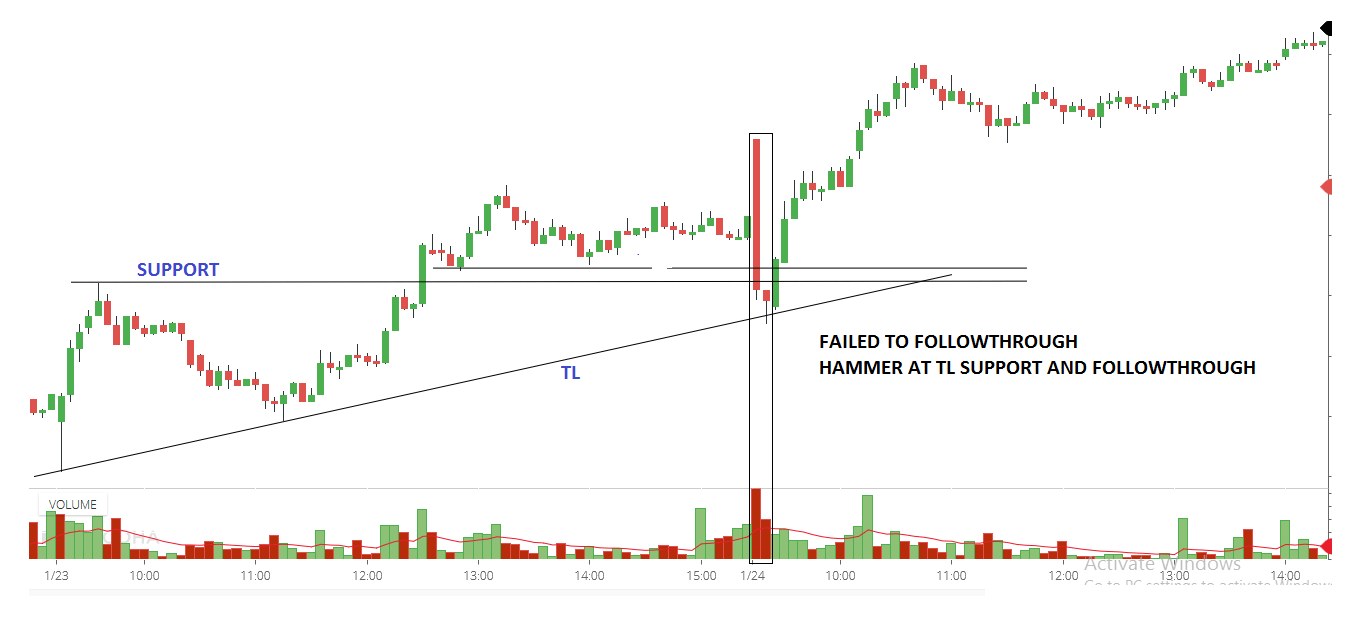
BREAKOUT AND PULLBACK
Any low volume pullback shows successful of breakout
How do I enter breakout trades?
Well, there are usually 3 ways you can trade a breakout.
You wait for a candle to close:
- It’s easier to execute the trade psychologically as the candle has closed in your favor
- You may get a poorer risk-to-reward (as the market has already moved in your favor)
You trade breakout using a stop order:
- It’s harder to execute the trade psychologically because there are no signs of “confirmation”
- You usually get a better risk-to-reward (as you’re entering near the breakout level)
You trade test of the breakout
After the breakout, any low volume test is a high probability entry with low risk and high reward


Tiada ulasan:
Catat Ulasan