Supply and Demand Zone Trading
Supply and Demand Zone Trading
In this article, I am going to discuss Supply and Demand Zone Trading in detail. Please read our previous article where we discussed How to Trade with Sideways Price Action Area. As part of this article, we are going to discuss the following pointers which are related to Supply and Demand Zone Trading.
- Structure of the market
- What is the supply-demand zone?
- How to find a supply and demand zone?
- Different types of zone
- How to measure the strength of the zone?
- When did the supply and demand zone break?
- How to trade with the supply and demand zone?
- Odd enhancer for trading with supply and demand zone
STRUCTURE OF MARKET
The price goes through the following phases
- ACCUMULATION
- REACCUMULATION
- UPTREND
- DISTRIBUTION
- REDISTRIBUTION
- DOWNTREND
ACCUMULATION smart money is removed the floating supply of stock by buying, this process is called accumulation
TREND UP smart money aggressively moving price up
DISTRIBUTION SM will take advantage of the higher prices obtained in the rally to take profits by beginning to sell the stock back to the uninformed traders/investors
LAWS OF SUPPLY AND DEMAND Trading
All financial markets work on the universal law of Supply and Demand.
Law of Demand– The higher the price of an item, the fewer the demand (buyers don’t want to buy at a higher price) and lower the price, higher the demand (buyers want to buy at a low price)
Law of Supply-the higher the price, the higher the supply (sellers want to sell at a higher price) and lower the price, lower the supply(sellers don’t want to supply at a lower price
What are Supply and Demand Zones
Supply-demand nothing but the border area of support or resistance
Let analyze NIFTY 50 STOCK
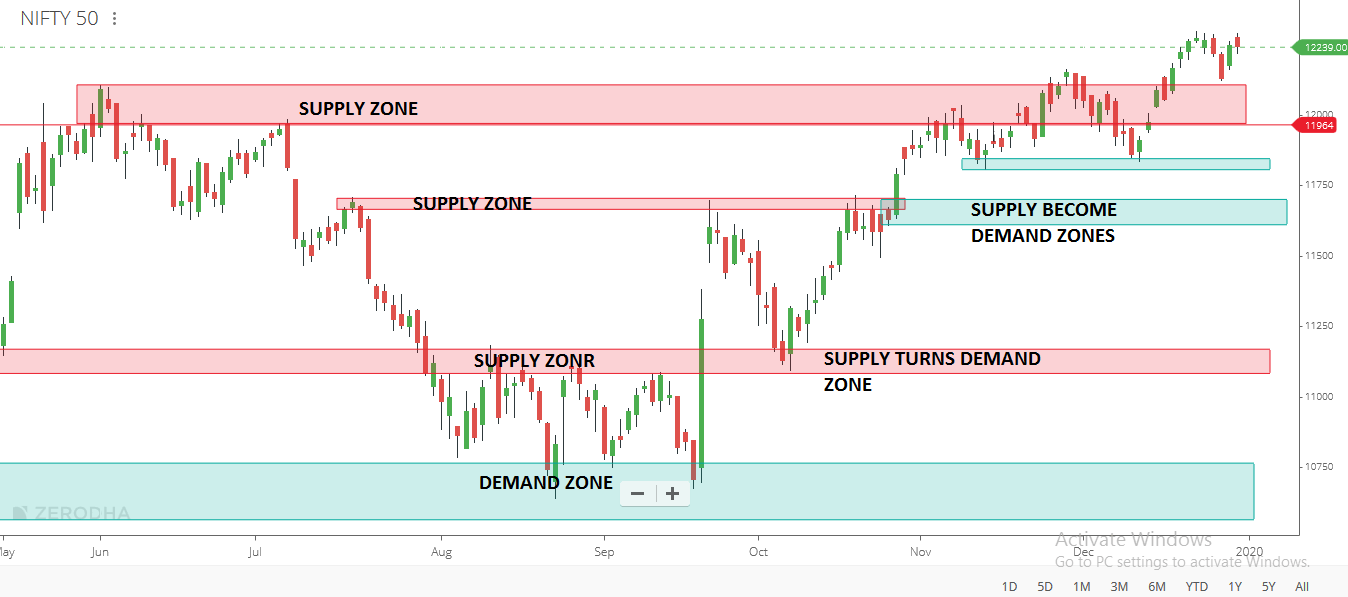
In the chart above you can see a demand zone (broad support level) and a supply zone (broad area of resistance).
What we want to find at the price zones where supply overwhelms demand and where demand overwhelms supply.
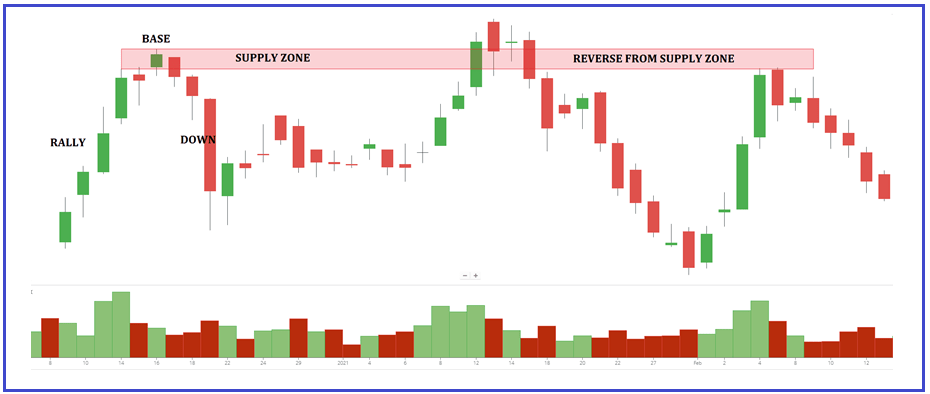
- The former is known as SUPPLY ZONES. When the market bumps into SUPPLY ZONES, the price will drop. Then, you can make money by shorting the market.
- The latter is market DEMAND ZONE. With the support of demand, the price will rise. Then, you can profit in a long position.
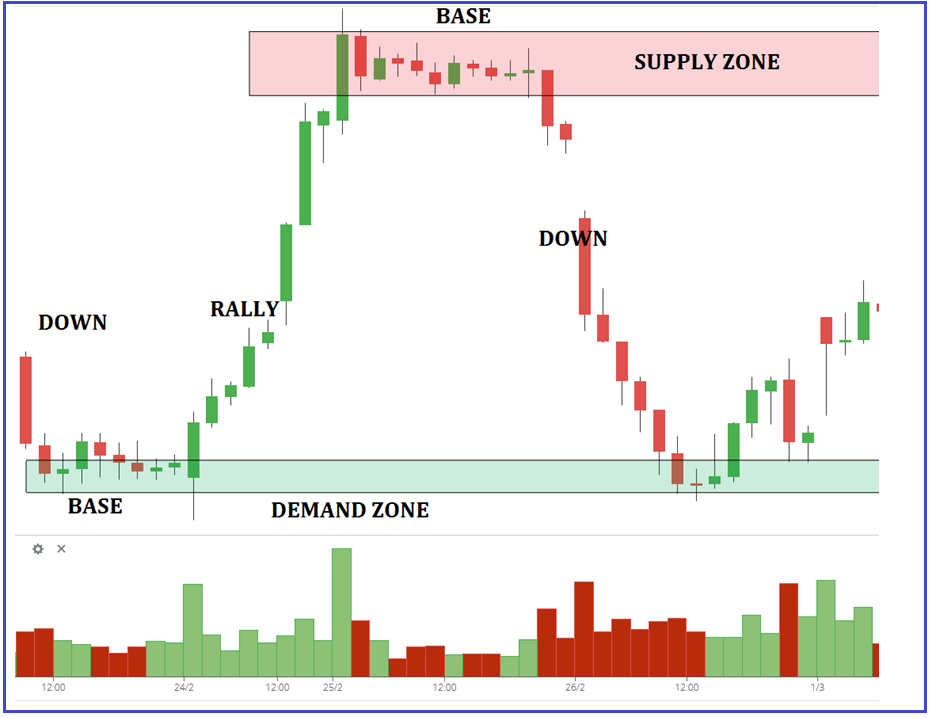
- IF the supply zone is broken it becomes a demand zone, pullback test from demand zone you can go long
How to Find Supply and Demand Zones in Trading
Two steps in order to identify the supply and demand zones.
- Look at the chart and try to spot successive large successive candles. It is important that price moves a lot
- Establish the base (usually sideways price action area) from which price started the quick move
Different Types of Supply and Demand Formations
There are different supply and demand zone patterns. Some of the more popular ones are shown below:
TREND CONTINUOUS BASE
- RALLY BASE RALLY(RBR)
- DOWN BASE DOWN (DBD)
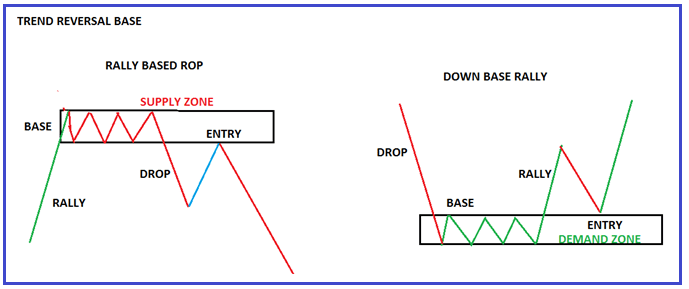
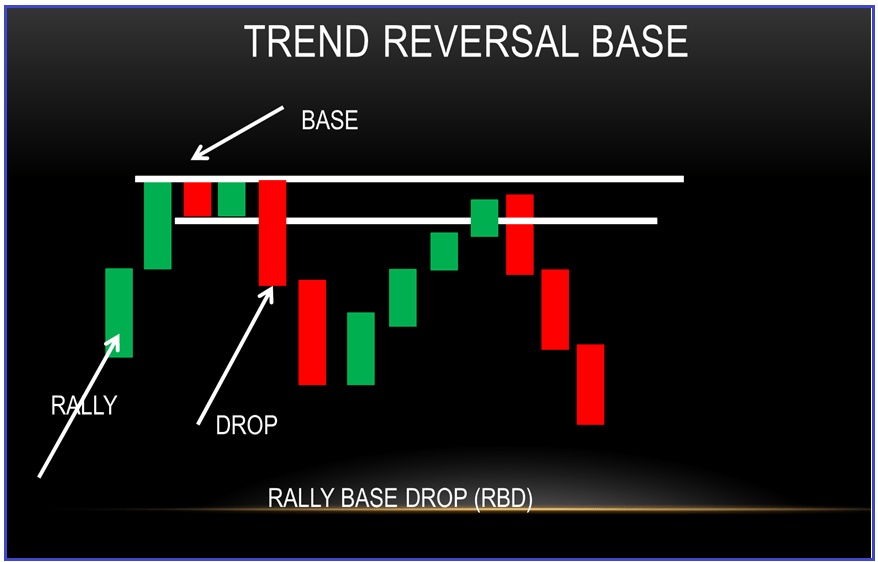
TREND REVERSAL BASE
- RALLY BASE DROP (RBD)
- DOWN BASE RALLY (DBR)
And
FLIP ZONE


NOW PUTTING ALL THIS TO NIFTY 50CHART

STRENGTH OF SUPPLY AND DEMAND ZONE
How did price leave the level? STRENGTH OF THE MOVE
The Logic: The stronger the price moves away from a zone, the more out-of-balance supply and demand are at that zone. A heavy order is placed by smart money

How much time did the price spend at the zone? TIME AT LEVEL
The Logic: The less time price spends at a zone, the more out-of-balance supply and demand are at the price level. Smart money aggressively entering
At price levels with supply and demand zone more out of balance, the price will spend the least amount of time at the level

How far did the price move away from the zone before returning back to the zone?
The Logic: The farther price moves away from a zone before returning to that zone, the greater the reward to risk and probability.
When price comes back to that supply level for our short entry, we have a good idea of where the buyers are (the demand) and just as importantly, where they are not.

How many times is the price approaching the zone? FRESHNESS OF BASE
First-time stock retrace to the base is the strongest to enter

When does Supply/Demand break?
After a zone is tested many times or during a strong move, Supply and Demand levels eventually break. Due to the remaining orders being triggered and gradually removed, or an overwhelming amount of orders in the opposite direction breaking the level.
Price action
- If the price stays near or at these zones & doesn’t fall much then there is a high probability that they will break the zone
- A strong move to the zone may break the zone
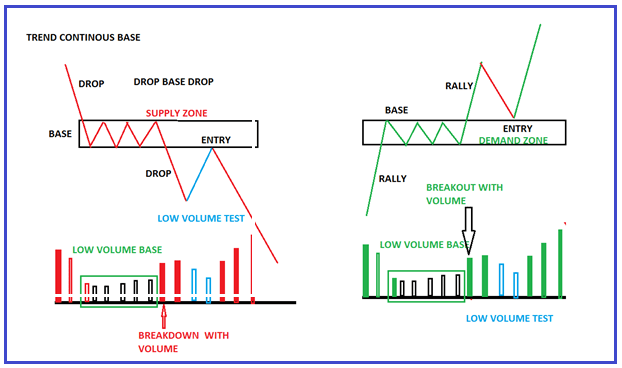
- low volume test confirm the zone
HOW TO ENTER DEMAND AND SUPPLY USING PRICE ACTION?
- Find SD zone on HTF(HIGHER TIME FRAME) then wait for the price to come to this level
- See any acceptance or rejection from this zone on trading time frame(TTF)
- Any reversal price action signal on TTF
- Entry in the direction of the dominant trend
- Suppose context downtrend, price rally to the supply zone on TTF, then any bearish reversal PA signal for an entry short
- Also, notice the volume on these reversals. A low volume test is a good sign & they are highly probable trades.
TIPS for day trading previous day high and previous day low is the supply and demand zone. look price action around there for acceptance or rejection of these zones
Let’s do an example
Find the supply and demand zone in a higher time frame
IN hourly time frame we find the zone
Big picture shows
1. whether trend up or down – determines which side we want to be on
2. Where the big picture support and demand levels?
We don’t want to long below the supply zone
WHEN PRICE APPROACHING TO DEMAND ZONE
WE WANT TO SEE SIGN OF STRENGTH PRICE ACTION FOR CONFIRMATION OF ZONE
- MOMENTUM LOSS(DECREASING CANDLE RANGE AND BODY
- LOWER WICK
- MIX OF BOTH RED AND GREEN CANDLE

Entry on the trading time frame

ENTRY SIGNAL CANDLE
Candlesticks AT Supply and Demand
- PIN BAR
- ENGULFING
- OUTSIDE CANDLE
Odds Enhancers example
- Trade with the trend
- If INDEX AND SECTOR SHOWS POSITIVE THEN GO LONG FROM DEMAND ZONE
Supply and Demand Trading (Part – 2)
This is Part 2 of Supply and Demand Trading. Please read Supply and Demand Trading Part – 1 before proceeding to this article. As part of this article, we are going to discuss the following pointers in detail.
- Which supply or demand zone reject the price
- Good zone vs bad zone
- Price action at supply and demand zone for confirmation
- How to find supply and demand zone
- How to draw supply and demand zone
- How to trade with supply and demand zone
Supply and Demand Zone types
There are different supply and demand zone patterns. shown below:
TREND CONTINUOUS BASE
- RALLY BASE RALLY(RBR)
- DOWN BASE DOWN (DBD)
TREND REVERSAL BASE
- RALLY BASE DROP (RBD)
- DOWN BASE RALLY (DBR)
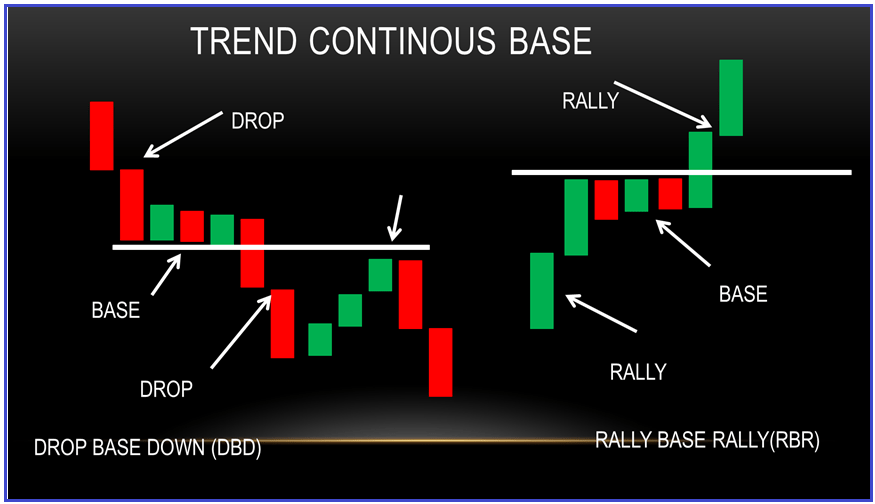
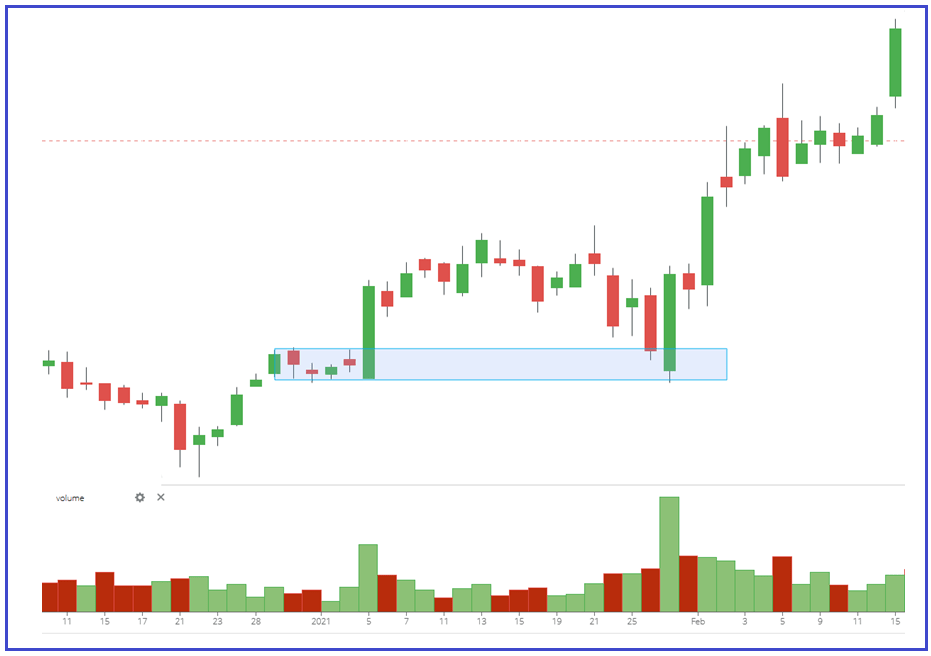
TREND CONTINUOUS BASE
- Rally Base Rally (RBR)
- Down Base Down (DBD)
TREND REVERSAL BASE
- Rally Base Drop (RBD)
- Down Base Rally (DBR)
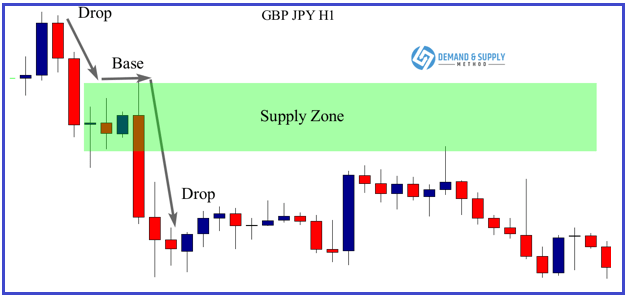
How to Find Supply and Demand Zones or institutional activity?
- Start at the current price
- Look left and find smart money activity
- Mark the base from which smart money activity initiates the trade
Smart money activity
There are three main signs of smart money activity we can spot with volume Price Action:
- Strong aggressive move with clear volume expansion
- Strong rejection or trapping
- Gap (check which gap)
Aggressive initiation activity
- If you are aggressive o buy or sell, you want to buy or sell now. It means, you place a MARKET ORDER to sell or buy immediately at the available current price
- Because your position is big, it won’t be filled all at once. It will get filled fast, you will be able to enter the full position, but the position will get split (due to the big position) as the price moves upward quickly. It is the aggressive market participants, who move the price aggressively up or down with their market orders.
- So, the supply and demand zone can only be seen once the price speeds away from the zone. It indicates that there was smart money buying or selling interest at the origin of that move
Aggressive volume price action activity
- STRONG AGGRESSIVE CANDLE
- CLEAN CLOSE
- INCREASING VOLUME
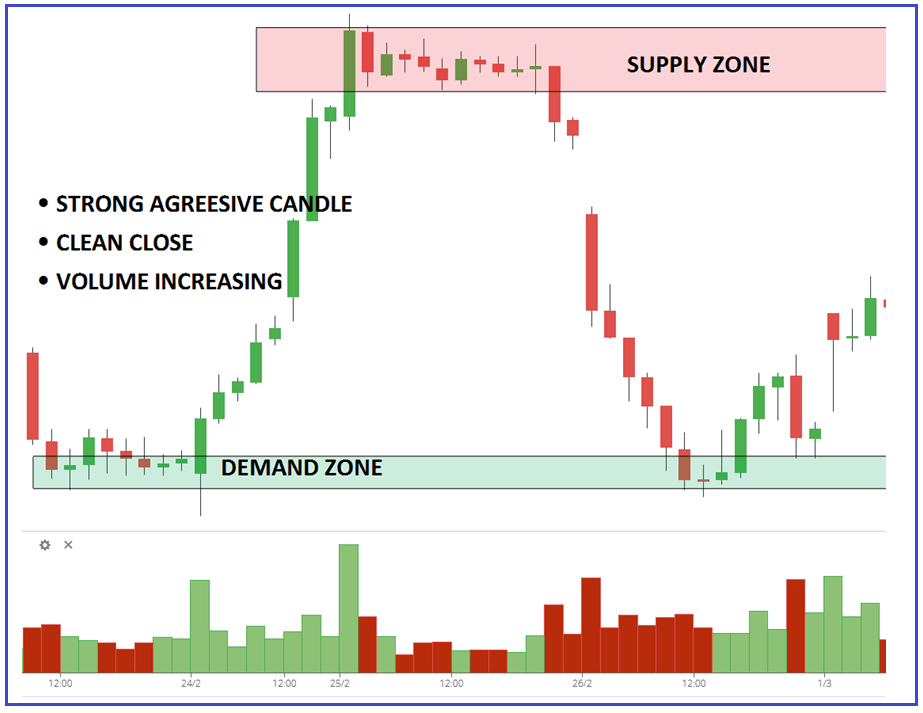
The strong rejection or V TURN
- Strong rejection of price levels is a sudden price reversal. This zone is made when the price goes one way aggressively and then turns quickly and with the same aggression and speed goes the other way
- What happens here is that one side of the market is aggressive and moves the price in one way. Then it clashes with the other side which suddenly becomes even stronger and even more aggressive. So, the price turns back quickly, and the stronger side takes over. Like V reversal
- The zone where the other side took over is very significant because it marks a place where strong market participants rejected aggressively and started a strong countermove. This zone is significant for us because it will most likely be defended again if the price gets near again. It becomes a new demand or supply zone.
- Pin bar or any reversal candlestick pattern formed at this zone
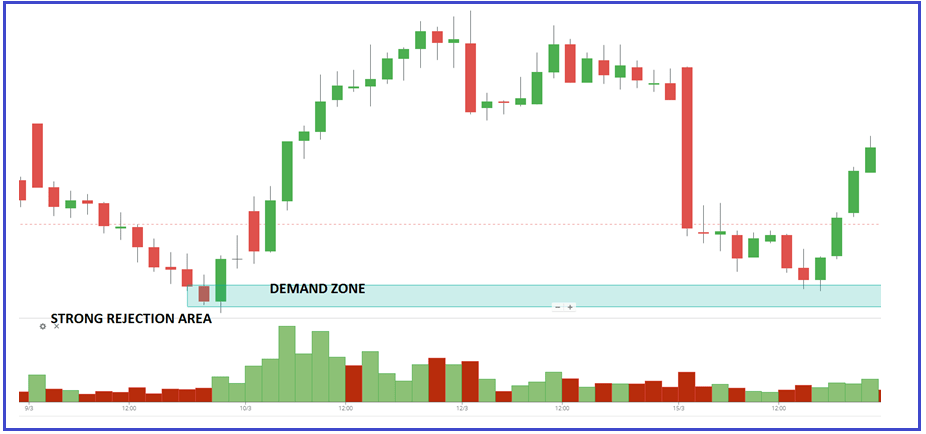
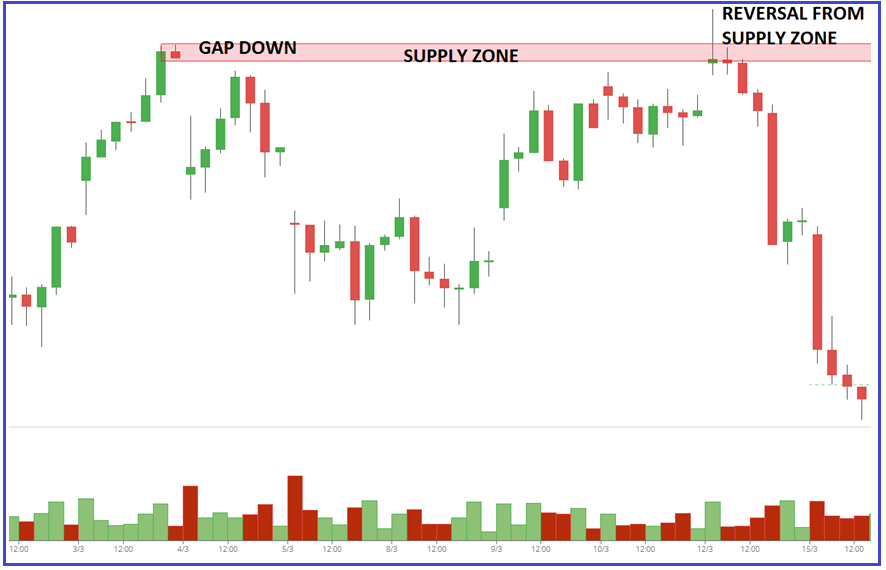
GAPS ARE THE STRONGEST FORM OF IMBALANCE
- Mark the gap from where it occurs
- Draw the zone(demand/supply) that is right below/above the gap, not the zone right before it.
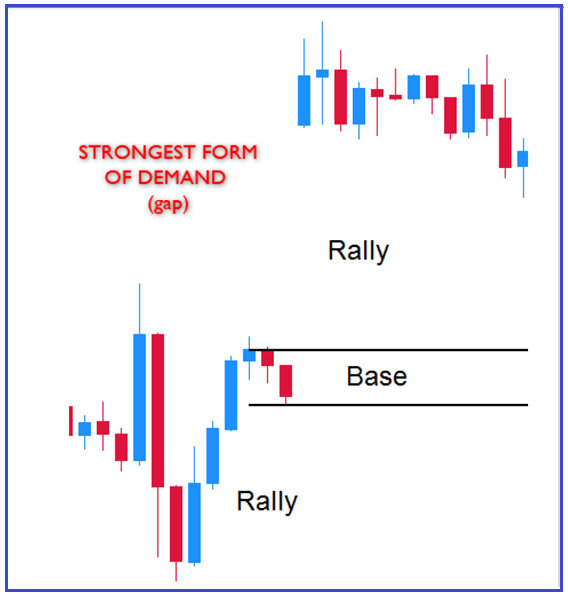
Please watch the following video if you want to learn and understand the Supply and Demand Trading concept in a better way.
ORIGINAL ARTICLES.. BELOW
Here, in this article, I try to explain Supply and Demand Trading. I hope you enjoy this Supply and Demand Trading article. Please join my Telegram Channel to learn more and clear your doubts. https://t.me/tradingwithsmartmoney.


Tiada ulasan:
Catat Ulasan