
Trading with Sideways Price Action Area
Trading with Sideways Price Action Area
In this article, I am going to discuss the two approaches to Trading with Sideways Price Action Area in detail. Please read our previous article where we discussed how to trade with smart money before proceeding to this article as it is a continuation part of how to trade with smart money. As part of this article, we are going to discuss the following pointers.
- Two approaches to trading with a sideways price action area
- How enter?
- How to exit?
- Odd enhancer
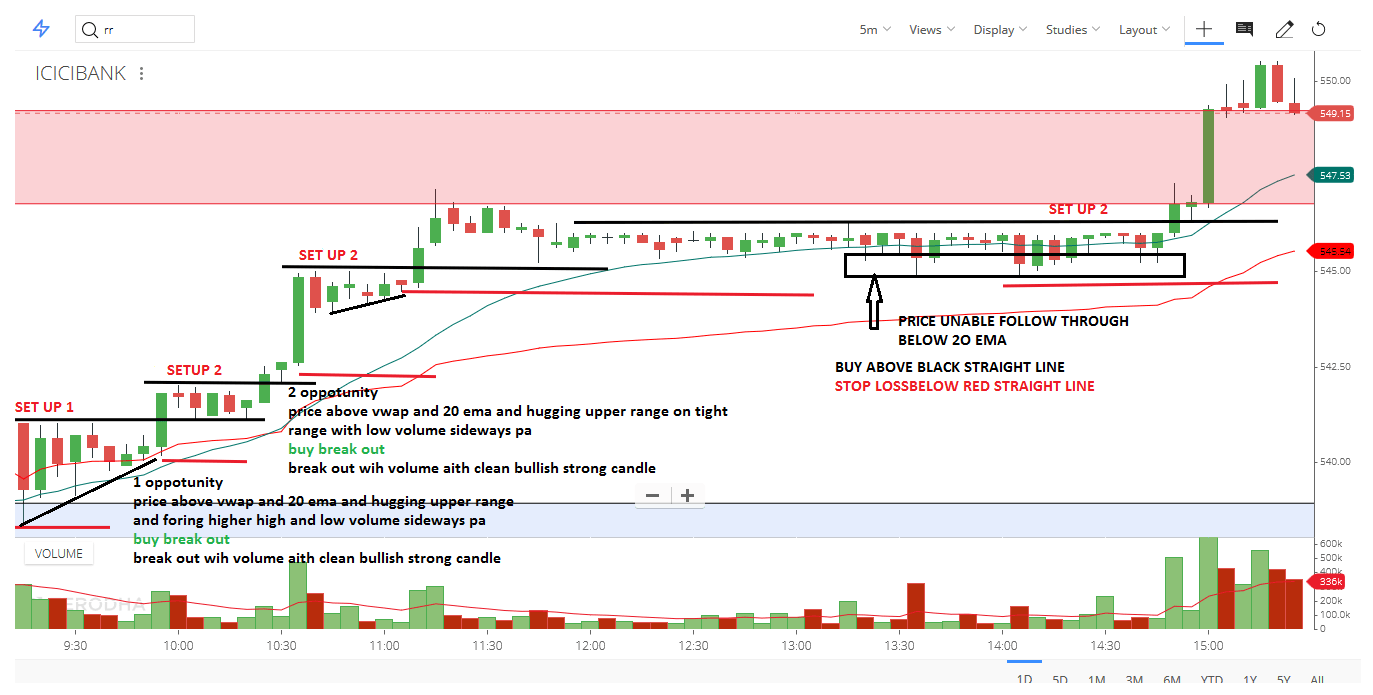
How to trade with SIDEWAYS Price Action Area Break Out?
Minimum three candles are required for sideways price action area break out.
Here are two approaches to trading the breakout designed to minimize risk:
- Buy the initial breakout when the conditions are right
- Buy the retracement to the breakout when you need confirmation
Break Out Condition
Now that you know TWO tactical approaches to trade the breakout, let’s look at how to recognize which OR breakouts are the best to trade. Again, I’ve created a quick checklist for evaluating a stock’s price and volume action. Remember these criteria are used not only to find stocks that are likely to lead to a successful breakout but also to define good risk points based on the stock’s price and volume action.
- For bullish breakouts. look for price to hug the top of the range
- The quicker you enter a range breakout trade, the better.
- Trade with the trend. In a bear market, downward breakouts tend to make more money than upward breakouts in intraday trading. In bull markets, upward breakouts make more money.
- For upward breakouts, trade only those situations where the price closes above the middle of the opening range most of the time. Downward breakouts from the opening range do best when the price resides below the range’s midpoint most often
- There is no resistance above breakout of bullish breakout
- Break out with volume
- After the breakout, the stock exhibit bullish price action for up break out
Trade set up 1: For Opening Sideways Price Action Breakout
Logic: 1st candle of the day should be heavy volume
Why heavy volume on the first candle of the day?
We are trying to identify what the SM sentiment is for the day?
If Smart Money wants to buy stock, we would see that on the open with heavy volume and strong directional move. Stock may gape at the opening. Which shows that stock may trend up the rest of the day?
Open = low of the first candle indicate SM strongly bullish
1st candle having lower wick indicate price tray to move down but Smart Money enter drive price higher
- 1st 5-minute candle be a wide range candle with a low wick or no wick with volume
- Stock in an uptrend with price above new demand
- The next candle/candles should be inside candle be a doji or a shooting star or narrow range candle with less volume
- The range stays within the top 2/3rd’s of 1st candle
Odd Enhancer
Avoid if
- Price extended from 20ma on entry time frame ( I am using 5 minutes)
- Sideways pa area volume almost equal or more relative to the first candle
- Entry time frame not trading just above demand or supply on a higher time frame
- Less than a 3 to 1 reward to risk ratio to target on the chart
3 action steps:
➡ Buy 1-2 cents above the second candle, preferably a Doji or shooting star
if playing long. Opposite for playing short.
➡ Upon entering your place stop loss 2 cents below 1st candle or low of the last swing low
➡ Target is 2R

Trade set up 2: Pull back Break Out
SEE THE PULLBACK FOR CONFIRMATION
SMART-MONEY ALWAYS BUY FROM VWAP OR AROUND VWAP, IF THEY WANT TO BUY
See the pullback to VWAP OR 20 EMA. If price pullback to VWAP EMA, but unable to push and hold below VWAP, indicating that buyers strength
Pullback condition
- Low volume
- Lower wick
- NARROW RANGE CANDLE
ODD ENHANCER
Avoid if
- Already traded to target on a bigger time frame
- Sideways pa area volume almost equal or more relative to the first candle
- Less than a 2 to 1 reward to risk ratio to target on the chart

Big picture
ON A DAILY TIME FRAME
On a daily in the uptrend

HIGHER TIME FRAME ANALYSIS
ON 30MINUES OR HOURLY TIME FRAME

TRADING TIME FRAME
I am using entry-exit for a 5-minute time frame


Tiada ulasan:
Catat Ulasan