
VIDEO : DIVERGENCE TRADING - TOP 10 Divergence Trading Strategies For Beginners | How To Trade Divergences Effortlessly
Using the divergence of a technical indicator from the movement in a market price is a day trading technique especially popular with forex traders.
- What is divergence in trading?
- How does it work?
- What are the best indicators to use divergence?
- Advantages and disadvantages of divergence
- Getting accurate trading signals from divergence
- Practise divergence trading with a FlowBank account
What is divergence in trading?
Divergence is a method used in technical analysis when the direction of a technical indicator, usually some form of oscillator ‘diverges’ from the overall price trend. In other words, the indicator starts moving in the opposite direction to the price and the trading oscillator signals a possible trend reversal.
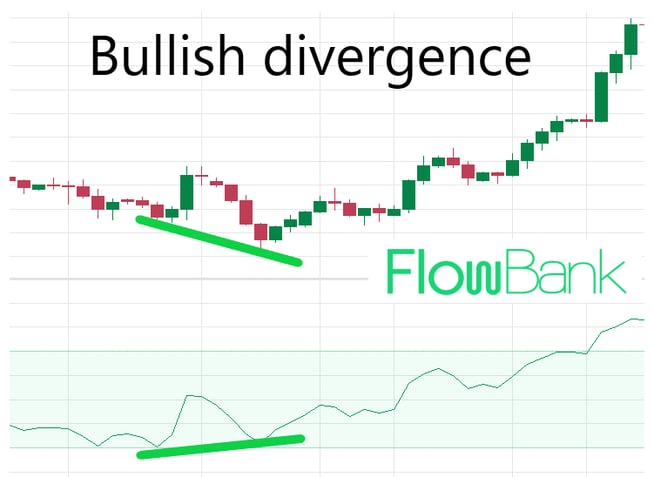
Bullish divergence is when the price is moving lower but the indicator turns and points up
Bearish divergence is when the price is moving higher but the indicator points down
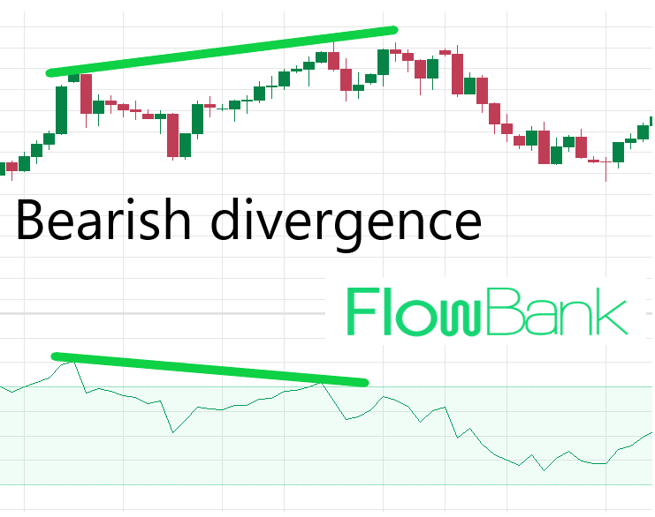
NOTE: it is what the technical indicator is doing that dictates whether the signal is considered bullish or bearish.
How does divergence in trading work?
The change in direction of the indicator is taken by day traders to mean that price might be about to follow. The oscillator in this scenario is used as a leading indicator for the price.
The logic behind divergence to analyse the market price is that the indicator is showing a slowdown in momentum of the price. The momentum of the price will often change before the price itself.
Think of it like if you throw a frisbee into a strong wind - the frisbee will go against the wind for some time, then it will slow down and lastly it changes direction and flies with the wind.
Which indicator is best for divergence?
There is no one single most popular indicator for trading divergence. Every technical indicator has its own benefits and pitfalls. We will cover the three most popular indicators: RSI, MACD and Stochastic.
Trading Strategy: RSI for trading divergence
The RSI indicator is a momentum indicator plotted as an oscillator between 0 and 100 under the candlestick chart, known as an underlay indicator. The RSI is calculated by averaging the price gains and losses over the previous 14 periods. It was created by J. Welles Wilder Jr in his book “New Concepts in Technical Trading systems.”
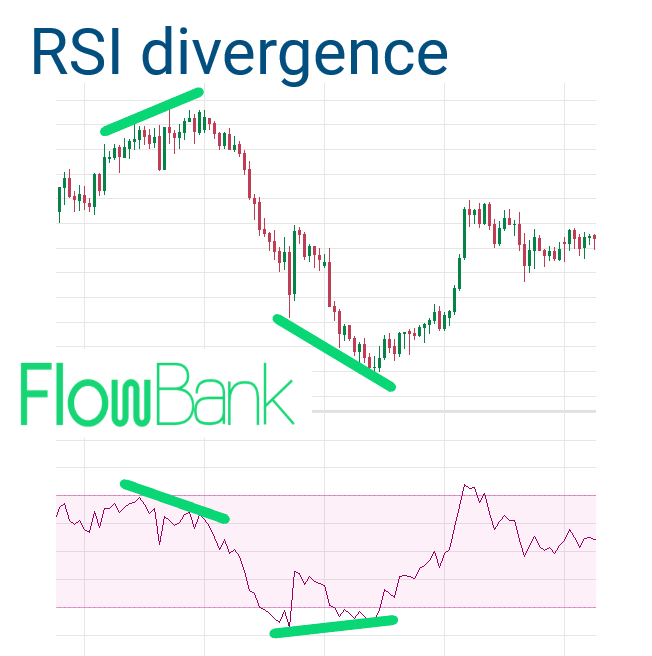
The indicator creates a smooth line that tends to track the trend in the price and lends itself well to divergence trading. When set to the default 14-period setting, the RSI indicator gives few overbought and oversold readings. That means that when it comes to using divergence as a trading signal, there tend to be less signals but they are more reliable when they occur.
Trading Strategy: MACD for divergence trading
The MACD is a momentum indicator that is best used in trend-following environments. The trend indicator plots a signal line as well as a histogram that shows the difference between two moving averages. The moving averages will converge and diverge as the trend progresses and eventually reverses.
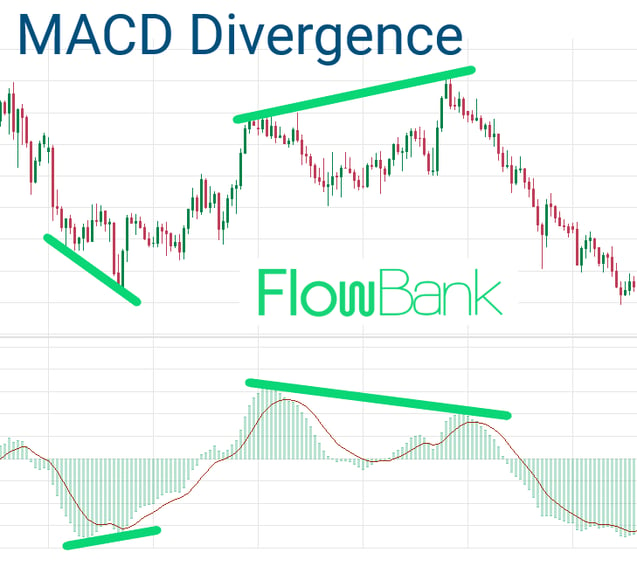
The visual of the histogram lends itself well to trading divergence but it is less open to interpretation when a new ‘swing point’ has been made. There is no pre-defined area of overbought and oversold in the MACD so deciding which trend trade signals are reliable enough to use is more difficult. This can be overcome by using previous peaks on the MACD as using them effectively as areas of support and resistance. Because it is best used in trending environments, the MACD will produce many false signals counter trend.
Stochastic for trading divergence
Stochastic is a momentum technical indicator that works by comparing the last closing price with a range of previous prices over the last 14 periods.
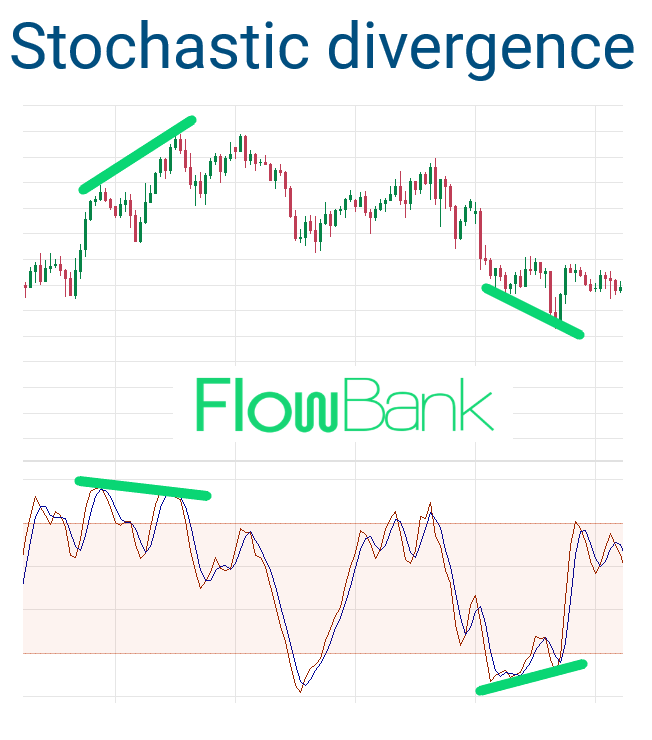
The stochastic is a more sensitive indicator, meaning it will offer more divergence signals and thus more trading opportunities but that also means more false signals.
Is trading divergence profitable?
Yes, but not all the time! We have to remember that indicators filter price action. That filter can help us focus on what is important or miss what's important, depending on the trade setup.
The major advantage of using divergence as a trading signal for how to time a trade entry is that it gives the signal before the price trend has changed. This early signal gives the trader a better entry price for their trade.
The disadvantage of using divergence as part of a good trading system is that it can give ‘false signals’. As the name suggests, this is when the indicator changes direction but the price trend does not reverse as the indicator suggested. This will quite often happen when the indicator gets very overbought or oversold. The momentum of the trend will weaken but the trend remains in tact.
How do you confirm divergence?
There are some tried and tested techniques to reduce the number of false signal and optimise the number of profitable trades.
- Only take divergence signals in the direction of the long term trend. Or alternatively in a rangebound sideways market. For example in a bear market, only take bearish RSI signals and in a bull market only take signals to buy from the RSI.
- Always wait for the candle that is confirming the divergence to close. Indicators will give a signal according to the current state of the candle. If the candle closes differently, a trading signal from divergence can disappear as quickly as it appeared.
- Use other indicators to confirm the signal such as support and resistance levels, round numbers, pivot points or a price action trading pattern.
Setting up your trading platform for divergence
From your FlowBank trading application you can right click on your chart and select indicators.
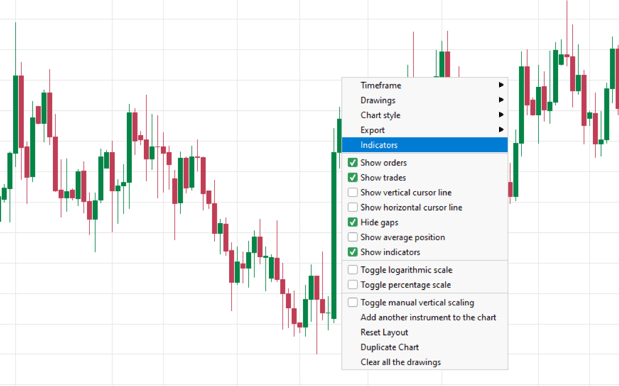
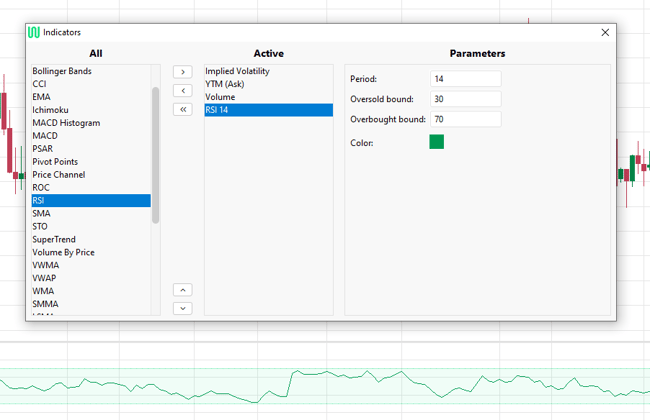
Then from the list of indicators, you can choose RSI, MACD or any of the popular indicators previously discussed. Then the indicator will appear on the chart and you can adjust the settings of the indicator. To remove the indicator you click the arrow to move it from ‘Active’ to ‘All’.
Should I trade using divergence?
In summary, trading divergence can be an effective addition to your trading strategy, especially if already using indicators like RSI or MACD to find overbought and oversold levels but should not be replied on by itself and requires practise to get it right.
Good luck trading !


Tiada ulasan:
Catat Ulasan